Morphelia
Morphological single cell analysis in python
This is a short introduction into the base functionality of Morphelia.
[ ]:
%load_ext autoreload
%autoreload 2

import numpy as np
import scanpy as sc
import pandas as pd
import anndata as ad

import morphelia
from morphelia.tools import LoadPlate
Step 1: Load Cellprofiler output into an annotated dataset
If used “ExportToSpreadSheet” module, the output directory contains a .csv-file for every mask with a row per sample and features as columns. We want to merge the information about nuclei, cells and cytoplasm (that we got from their respective mask) and store morphological features along with cell annotations (like plate name, well, field, etc.).
AnnData is a popular library for single cell analysis, typically single-cell RNA-sequencing. It uses HDF5 as dataformat. More information here: https://anndata.readthedocs.io/en/stable/index.html
[8]:
# path to plate directory
path = '../data/cp_output/'

plate = LoadPlate(path,
                  obj_sfx=".txt",   # --> suffix
                  obj_delimiter="\t",   # --> delimiter of values
                  treat_file="Treatment")   # --> name of treatment file

plate.load()    # --> merge and load to pandas
plate = plate.to_anndata()  # --> convert to anndata
Let’s visualize our AnnData object. We have 477 cells and 2961 features. The observations (obs) indicate our annotations.
[4]:
plate
[4]:
AnnData object with n_obs × n_vars = 477 × 2961
    obs: 'ImageNumber', 'ObjectNumber', 'Metadata_Col', 'Metadata_Field', 'Metadata_FileLocation', 'Metadata_Frame', 'Metadata_Row', 'Metadata_Series', 'Metadata_Well', 'Cells_AreaShape_BoundingBoxArea', 'Cells_AreaShape_BoundingBoxMaximum_X', 'Cells_AreaShape_BoundingBoxMaximum_Y', 'Cells_AreaShape_BoundingBoxMinimum_X', 'Cells_AreaShape_BoundingBoxMinimum_Y', 'Cells_AreaShape_Center_X', 'Cells_AreaShape_Center_Y', 'Cells_AreaShape_EulerNumber', 'Cells_Children_Cytoplasm_Count', 'Cells_Children_Nuc_1_Count', 'Cells_Children_Nuclei_Count', 'Cells_Children_Primarieswithoutborder_Count', 'Cells_Children_Primarieswithoutborder_Count.1', 'Cells_Location_CenterMassIntensity_X_Actin', 'Cells_Location_CenterMassIntensity_X_Brightfield', 'Cells_Location_CenterMassIntensity_X_DNA', 'Cells_Location_CenterMassIntensity_X_Desmin', 'Cells_Location_CenterMassIntensity_X_PC', 'Cells_Location_CenterMassIntensity_Y_Actin', 'Cells_Location_CenterMassIntensity_Y_Brightfield', 'Cells_Location_CenterMassIntensity_Y_DNA', 'Cells_Location_CenterMassIntensity_Y_Desmin', 'Cells_Location_CenterMassIntensity_Y_PC', 'Cells_Location_CenterMassIntensity_Z_Actin', 'Cells_Location_CenterMassIntensity_Z_Brightfield', 'Cells_Location_CenterMassIntensity_Z_DNA', 'Cells_Location_CenterMassIntensity_Z_Desmin', 'Cells_Location_CenterMassIntensity_Z_PC', 'Cells_Location_Center_X', 'Cells_Location_Center_Y', 'Cells_Location_Center_Z', 'Cells_Location_MaxIntensity_X_Actin', 'Cells_Location_MaxIntensity_X_Brightfield', 'Cells_Location_MaxIntensity_X_DNA', 'Cells_Location_MaxIntensity_X_Desmin', 'Cells_Location_MaxIntensity_X_PC', 'Cells_Location_MaxIntensity_Y_Actin', 'Cells_Location_MaxIntensity_Y_Brightfield', 'Cells_Location_MaxIntensity_Y_DNA', 'Cells_Location_MaxIntensity_Y_Desmin', 'Cells_Location_MaxIntensity_Y_PC', 'Cells_Location_MaxIntensity_Z_Actin', 'Cells_Location_MaxIntensity_Z_Brightfield', 'Cells_Location_MaxIntensity_Z_DNA', 'Cells_Location_MaxIntensity_Z_Desmin', 'Cells_Location_MaxIntensity_Z_PC', 'Cells_Neighbors_FirstClosestObjectNumber_20', 'Cells_Neighbors_FirstClosestObjectNumber_Adjacent', 'Cells_Neighbors_NumberOfNeighbors_20', 'Cells_Neighbors_NumberOfNeighbors_Adjacent', 'Cells_Neighbors_SecondClosestObjectNumber_20', 'Cells_Neighbors_SecondClosestObjectNumber_Adjacent', 'Cells_Number_Object_Number', 'Cells_Parent_Nuc_10', 'Cells_Parent_Primarieswithoutborder', 'Primarieswithoutborder_AreaShape_BoundingBoxArea', 'Primarieswithoutborder_AreaShape_BoundingBoxMaximum_X', 'Primarieswithoutborder_AreaShape_BoundingBoxMaximum_Y', 'Primarieswithoutborder_AreaShape_BoundingBoxMinimum_X', 'Primarieswithoutborder_AreaShape_BoundingBoxMinimum_Y', 'Primarieswithoutborder_AreaShape_Center_X', 'Primarieswithoutborder_AreaShape_Center_Y', 'Primarieswithoutborder_AreaShape_EulerNumber', 'Primarieswithoutborder_Children_Cells_Count', 'Primarieswithoutborder_Children_Cytoplasm_Count', 'Primarieswithoutborder_Children_Primaries_Count', 'Primarieswithoutborder_Location_CenterMassIntensity_X_Actin', 'Primarieswithoutborder_Location_CenterMassIntensity_X_Brightfield', 'Primarieswithoutborder_Location_CenterMassIntensity_X_DNA', 'Primarieswithoutborder_Location_CenterMassIntensity_X_Desmin', 'Primarieswithoutborder_Location_CenterMassIntensity_X_PC', 'Primarieswithoutborder_Location_CenterMassIntensity_Y_Actin', 'Primarieswithoutborder_Location_CenterMassIntensity_Y_Brightfield', 'Primarieswithoutborder_Location_CenterMassIntensity_Y_DNA', 'Primarieswithoutborder_Location_CenterMassIntensity_Y_Desmin', 'Primarieswithoutborder_Location_CenterMassIntensity_Y_PC', 'Primarieswithoutborder_Location_CenterMassIntensity_Z_Actin', 'Primarieswithoutborder_Location_CenterMassIntensity_Z_Brightfield', 'Primarieswithoutborder_Location_CenterMassIntensity_Z_DNA', 'Primarieswithoutborder_Location_CenterMassIntensity_Z_Desmin', 'Primarieswithoutborder_Location_CenterMassIntensity_Z_PC', 'Primarieswithoutborder_Location_Center_X', 'Primarieswithoutborder_Location_Center_Y', 'Primarieswithoutborder_Location_Center_Z', 'Primarieswithoutborder_Location_MaxIntensity_X_Actin', 'Primarieswithoutborder_Location_MaxIntensity_X_Brightfield', 'Primarieswithoutborder_Location_MaxIntensity_X_DNA', 'Primarieswithoutborder_Location_MaxIntensity_X_Desmin', 'Primarieswithoutborder_Location_MaxIntensity_X_PC', 'Primarieswithoutborder_Location_MaxIntensity_Y_Actin', 'Primarieswithoutborder_Location_MaxIntensity_Y_Brightfield', 'Primarieswithoutborder_Location_MaxIntensity_Y_DNA', 'Primarieswithoutborder_Location_MaxIntensity_Y_Desmin', 'Primarieswithoutborder_Location_MaxIntensity_Y_PC', 'Primarieswithoutborder_Location_MaxIntensity_Z_Actin', 'Primarieswithoutborder_Location_MaxIntensity_Z_Brightfield', 'Primarieswithoutborder_Location_MaxIntensity_Z_DNA', 'Primarieswithoutborder_Location_MaxIntensity_Z_Desmin', 'Primarieswithoutborder_Location_MaxIntensity_Z_PC', 'Primarieswithoutborder_Number_Object_Number', 'Primarieswithoutborder_Parent_Cells', 'Primarieswithoutborder_Parent_Nuc_10', 'Cytoplasm_AreaShape_BoundingBoxArea', 'Cytoplasm_AreaShape_BoundingBoxMaximum_X', 'Cytoplasm_AreaShape_BoundingBoxMaximum_Y', 'Cytoplasm_AreaShape_BoundingBoxMinimum_X', 'Cytoplasm_AreaShape_BoundingBoxMinimum_Y', 'Cytoplasm_AreaShape_Center_X', 'Cytoplasm_AreaShape_Center_Y', 'Cytoplasm_AreaShape_EulerNumber', 'Cytoplasm_Location_CenterMassIntensity_X_Actin', 'Cytoplasm_Location_CenterMassIntensity_X_Brightfield', 'Cytoplasm_Location_CenterMassIntensity_X_DNA', 'Cytoplasm_Location_CenterMassIntensity_X_Desmin', 'Cytoplasm_Location_CenterMassIntensity_X_PC', 'Cytoplasm_Location_CenterMassIntensity_Y_Actin', 'Cytoplasm_Location_CenterMassIntensity_Y_Brightfield', 'Cytoplasm_Location_CenterMassIntensity_Y_DNA', 'Cytoplasm_Location_CenterMassIntensity_Y_Desmin', 'Cytoplasm_Location_CenterMassIntensity_Y_PC', 'Cytoplasm_Location_CenterMassIntensity_Z_Actin', 'Cytoplasm_Location_CenterMassIntensity_Z_Brightfield', 'Cytoplasm_Location_CenterMassIntensity_Z_DNA', 'Cytoplasm_Location_CenterMassIntensity_Z_Desmin', 'Cytoplasm_Location_CenterMassIntensity_Z_PC', 'Cytoplasm_Location_Center_X', 'Cytoplasm_Location_Center_Y', 'Cytoplasm_Location_MaxIntensity_X_Actin', 'Cytoplasm_Location_MaxIntensity_X_Brightfield', 'Cytoplasm_Location_MaxIntensity_X_DNA', 'Cytoplasm_Location_MaxIntensity_X_Desmin', 'Cytoplasm_Location_MaxIntensity_X_PC', 'Cytoplasm_Location_MaxIntensity_Y_Actin', 'Cytoplasm_Location_MaxIntensity_Y_Brightfield', 'Cytoplasm_Location_MaxIntensity_Y_DNA', 'Cytoplasm_Location_MaxIntensity_Y_Desmin', 'Cytoplasm_Location_MaxIntensity_Y_PC', 'Cytoplasm_Location_MaxIntensity_Z_Actin', 'Cytoplasm_Location_MaxIntensity_Z_Brightfield', 'Cytoplasm_Location_MaxIntensity_Z_DNA', 'Cytoplasm_Location_MaxIntensity_Z_Desmin', 'Cytoplasm_Location_MaxIntensity_Z_PC', 'Cytoplasm_Number_Object_Number', 'Cytoplasm_Parent_Cells', 'Cytoplasm_Parent_Primarieswithoutborder', 'Metadata_Treatment', 'Metadata_Concentration', 'Metadata_Unit'
The annotations are stored as pandas DataFrame, all other values are stored as a Numpy array. We can get the annotations and values as following:
[5]:
# annotations
plate.obs.head()
[5]:
| ImageNumber | ObjectNumber | Metadata_Col | Metadata_Field | Metadata_FileLocation | Metadata_Frame | Metadata_Row | Metadata_Series | Metadata_Well | Cells_AreaShape_BoundingBoxArea | ... | Cytoplasm_Location_MaxIntensity_Z_Brightfield | Cytoplasm_Location_MaxIntensity_Z_DNA | Cytoplasm_Location_MaxIntensity_Z_Desmin | Cytoplasm_Location_MaxIntensity_Z_PC | Cytoplasm_Number_Object_Number | Cytoplasm_Parent_Cells | Cytoplasm_Parent_Primarieswithoutborder | Metadata_Treatment | Metadata_Concentration | Metadata_Unit | |
|---|---|---|---|---|---|---|---|---|---|---|---|---|---|---|---|---|---|---|---|---|---|
| 0 | 1 | 1 | 3 | 6 | NaN | 0 | E | 0 | E3 | 9044 | ... | 0.0 | 0.0 | 0.0 | 0.0 | 1 | 1 | 1 | Pe | 0.001 | mg/ml |
| 1 | 1 | 2 | 3 | 6 | NaN | 0 | E | 0 | E3 | 16093 | ... | 0.0 | 0.0 | 0.0 | 0.0 | 2 | 2 | 2 | Pe | 0.001 | mg/ml |
| 2 | 1 | 3 | 3 | 6 | NaN | 0 | E | 0 | E3 | 15456 | ... | 0.0 | 0.0 | 0.0 | 0.0 | 3 | 3 | 3 | Pe | 0.001 | mg/ml |
| 3 | 1 | 4 | 3 | 6 | NaN | 0 | E | 0 | E3 | 15232 | ... | 0.0 | 0.0 | 0.0 | 0.0 | 4 | 4 | 4 | Pe | 0.001 | mg/ml |
| 4 | 1 | 5 | 3 | 6 | NaN | 0 | E | 0 | E3 | 14940 | ... | 0.0 | 0.0 | 0.0 | 0.0 | 5 | 5 | 5 | Pe | 0.001 | mg/ml |
5 rows × 157 columns
[6]:
# values
plate.X
[6]:
array([[4.92600000e+03, 2.03454280e+00, 8.00544560e-01, ...,
        8.68238322e-03, 1.29114211e-01, 6.12741292e-01],
       [9.32800000e+03, 1.90278614e+00, 7.68818259e-01, ...,
        8.51453468e-03, 9.40871313e-02, 6.02670312e-01],
       [9.46200000e+03, 2.28528094e+00, 8.81704628e-01, ...,
        8.34668521e-03, 6.98977634e-02, 5.88120878e-01],
       ...,
       [5.29400000e+03, 1.79038346e+00, 8.93598557e-01, ...,
        1.79789420e-02, 2.43095294e-01, 7.64938593e-01],
       [3.34600000e+03, 1.45021796e+00, 7.79904485e-01, ...,
        1.30769815e-02, 1.53440908e-01, 7.59849727e-01],
       [5.78600000e+03, 2.22282672e+00, 9.32412803e-01, ...,
        1.34393834e-02, 1.65487900e-01, 7.34824896e-01]], dtype=float32)
[7]:
# feature names
plate.var
[7]:
| Cells_AreaShape_Area |
|---|
| Cells_AreaShape_Compactness |
| Cells_AreaShape_Eccentricity |
| Cells_AreaShape_EquivalentDiameter |
| Cells_AreaShape_Extent |
| ... |
| Cytoplasm_Intensity_UpperQuartileIntensity_Actin |
| Cytoplasm_Intensity_UpperQuartileIntensity_Brightfield |
| Cytoplasm_Intensity_UpperQuartileIntensity_DNA |
| Cytoplasm_Intensity_UpperQuartileIntensity_Desmin |
| Cytoplasm_Intensity_UpperQuartileIntensity_PC |
2961 rows × 0 columns
AnnData was build together with Scanpy (short for single cell analysis in python), another useful library we use. It contains functions for preprocessing, analysis and plotting. Even if a lot of functions were originally build for single-cell RNA-sequencing, we can also use them for image-based profiling. More information here: https://scanpy.readthedocs.io/en/stable/index.html
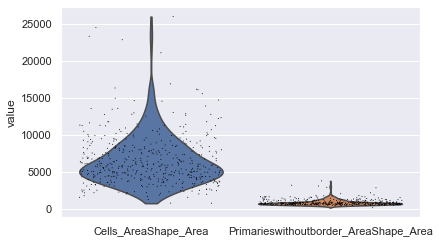
Let’s use Scanpy to plot some feature distributions.
[11]:
# list feature names
plate.var_names
[11]:
Index(['Cells_AreaShape_Area', 'Cells_AreaShape_Compactness',
       'Cells_AreaShape_Eccentricity', 'Cells_AreaShape_EquivalentDiameter',
       'Cells_AreaShape_Extent', 'Cells_AreaShape_FormFactor',
       'Cells_AreaShape_MajorAxisLength', 'Cells_AreaShape_MaxFeretDiameter',
       'Cells_AreaShape_MaximumRadius', 'Cells_AreaShape_MeanRadius',
       ...
       'Cytoplasm_Intensity_StdIntensity_Actin',
       'Cytoplasm_Intensity_StdIntensity_Brightfield',
       'Cytoplasm_Intensity_StdIntensity_DNA',
       'Cytoplasm_Intensity_StdIntensity_Desmin',
       'Cytoplasm_Intensity_StdIntensity_PC',
       'Cytoplasm_Intensity_UpperQuartileIntensity_Actin',
       'Cytoplasm_Intensity_UpperQuartileIntensity_Brightfield',
       'Cytoplasm_Intensity_UpperQuartileIntensity_DNA',
       'Cytoplasm_Intensity_UpperQuartileIntensity_Desmin',
       'Cytoplasm_Intensity_UpperQuartileIntensity_PC'],
      dtype='object', length=2961)
[14]:
# violing plot
sc.pl.violin(plate, ['Cells_AreaShape_Area', 'Primarieswithoutborder_AreaShape_Area'],
             jitter=0.4)
[18]:
sc.pl.scatter(plate, x='Cells_AreaShape_Area', y='Primarieswithoutborder_AreaShape_Area',
              color='Cells_Intensity_MeanIntensity_Desmin')

Finally, the anndata object can be stored in h5ad-format, a custom AnnData HDF5-format.
[3]:
plate.write('../data/plate_raw.h5ad')
C:\Users\amarx\Anaconda3\envs\morphelia\lib\site-packages\anndata\_core\anndata.py:1228: FutureWarning: The `inplace` parameter in pandas.Categorical.reorder_categories is deprecated and will be removed in a future version. Reordering categories will always return a new Categorical object.
  c.reorder_categories(natsorted(c.categories), inplace=True)
... storing 'Metadata_Row' as categorical
C:\Users\amarx\Anaconda3\envs\morphelia\lib\site-packages\anndata\_core\anndata.py:1228: FutureWarning: The `inplace` parameter in pandas.Categorical.reorder_categories is deprecated and will be removed in a future version. Reordering categories will always return a new Categorical object.
  c.reorder_categories(natsorted(c.categories), inplace=True)
... storing 'Metadata_Well' as categorical
C:\Users\amarx\Anaconda3\envs\morphelia\lib\site-packages\anndata\_core\anndata.py:1228: FutureWarning: The `inplace` parameter in pandas.Categorical.reorder_categories is deprecated and will be removed in a future version. Reordering categories will always return a new Categorical object.
  c.reorder_categories(natsorted(c.categories), inplace=True)
... storing 'Metadata_Treatment' as categorical
C:\Users\amarx\Anaconda3\envs\morphelia\lib\site-packages\anndata\_core\anndata.py:1228: FutureWarning: The `inplace` parameter in pandas.Categorical.reorder_categories is deprecated and will be removed in a future version. Reordering categories will always return a new Categorical object.
  c.reorder_categories(natsorted(c.categories), inplace=True)
... storing 'Metadata_Unit' as categorical
Step 2: Preprocessing
This includes the following steps:
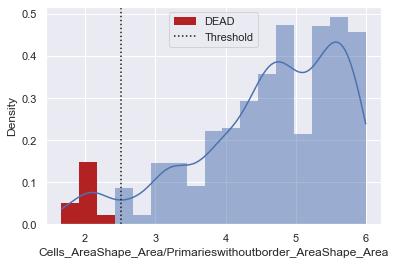
filter dead cells and cells that have Nan-values for important features
dead cells a low Cell Area - Nuclei Area ratio
drop features that contain Nan-values
drop features that are duplicates of other features
drop invariant features
normalize the data
[22]:
# filter dead cells
plate = morphelia.pp.filter_debris(plate, show=True, verbose=True,
                                   max_quot=6)
7 cells filtered
[23]:
# variables that should not contain any nan values
not_nan = ['Cells_AreaShape_Area', 'Cytoplasm_AreaShape_Area', 'Primarieswithoutborder_AreaShape_Area',
           'Cytoplasm_AreaShape_FormFactor']

len_before = len(plate)
plate = plate[~np.isnan(plate[:, not_nan].X).any(axis=1), :].copy()
plate = plate[~np.isinf(plate[:, not_nan].X).any(axis=1), :].copy()
print(f"{len_before - len(plate)} cells with nan values dropped")
0 cells with nan values dropped
[24]:
plate = morphelia.pp.drop_nan(plate, verbose=True)
plate = morphelia.pp.drop_duplicates(plate, verbose=True)
plate = morphelia.pp.drop_invariant(plate, verbose=True)
Dropped 317 duplicated features: Index(['Cells_Granularity_10_Actin.1', 'Cells_Granularity_10_Brightfield.1',
       'Cells_Granularity_10_DNA.1', 'Cells_Granularity_10_Desmin.1',
       'Cells_Granularity_10_PC.1', 'Cells_Granularity_11_Actin.1',
       'Cells_Granularity_11_Brightfield.1', 'Cells_Granularity_11_DNA.1',
       'Cells_Granularity_11_Desmin.1', 'Cells_Granularity_11_PC.1',
       ...
       'Primarieswithoutborder_Granularity_9_Desmin.1',
       'Primarieswithoutborder_Granularity_9_PC.1',
       'Primarieswithoutborder_RadialDistribution_ZernikePhase_Actin_0_0',
       'Primarieswithoutborder_RadialDistribution_ZernikePhase_Brightfield_0_0',
       'Primarieswithoutborder_RadialDistribution_ZernikePhase_DNA_0_0',
       'Primarieswithoutborder_RadialDistribution_ZernikePhase_DNA_2_0',
       'Primarieswithoutborder_RadialDistribution_ZernikePhase_Desmin_0_0',
       'Primarieswithoutborder_RadialDistribution_ZernikePhase_PC_0_0',
       'Cytoplasm_Intensity_MinIntensityEdge_DNA',
       'Cytoplasm_Intensity_MinIntensity_DNA'],
      dtype='object', length=317)
Dropped 1 invariant features: Index(['Cells_RadialDistribution_ZernikePhase_Actin_0_0'], dtype='object')
[25]:
plate = morphelia.pp.normalize(plate, method='standard',
                               by=None,
                               verbose=True)
Step 3: Feature extraction
[26]:
plate = morphelia.ft.drop_noise(plate, verbose=True)
Drop 2349 noisy features: Index(['Primarieswithoutborder_RadialDistribution_ZernikePhase_Brightfield_9_1',
       'Cells_RadialDistribution_ZernikePhase_DNA_8_8',
       'Primarieswithoutborder_RadialDistribution_ZernikePhase_Desmin_5_5',
       'Cells_RadialDistribution_ZernikePhase_PC_7_1',
       'Primarieswithoutborder_RadialDistribution_ZernikePhase_PC_4_2',
       'Primarieswithoutborder_RadialDistribution_ZernikePhase_Actin_1_1',
       'Cells_RadialDistribution_ZernikePhase_PC_5_3',
       'Cells_RadialDistribution_ZernikePhase_PC_8_6',
       'Primarieswithoutborder_RadialDistribution_ZernikePhase_Actin_9_9',
       'Cells_RadialDistribution_ZernikePhase_Desmin_5_3',
       ...
       'Primarieswithoutborder_Texture_SumVariance_PC_10_03_256',
       'Cytoplasm_Intensity_IntegratedIntensity_PC',
       'Primarieswithoutborder_Texture_SumVariance_PC_10_00_256',
       'Primarieswithoutborder_Texture_SumVariance_PC_3_03_256',
       'Primarieswithoutborder_Texture_SumVariance_PC_3_02_256',
       'Primarieswithoutborder_Texture_SumVariance_PC_3_01_256',
       'Cells_Intensity_IntegratedIntensity_PC',
       'Primarieswithoutborder_Texture_SumVariance_PC_3_00_256',
       'Cytoplasm_AreaShape_Area', 'Cells_AreaShape_Area'],
      dtype='object', length=2349)
[27]:
plate = morphelia.ft.drop_near_zero_variance(plate, verbose=True)
Iterating over features: 100%|██████████| 294/294 [00:02<00:00, 102.81it/s]
Drop 19 features with low variance: ['Primarieswithoutborder_Granularity_13_DNA', 'Primarieswithoutborder_Granularity_23_DNA', 'Cells_Granularity_23_Brightfield', 'Primarieswithoutborder_Granularity_28_DNA', 'Cells_Granularity_29_DNA', 'Cells_Granularity_26_PC', 'Primarieswithoutborder_RadialDistribution_ZernikePhase_Brightfield_2_0', 'Cells_RadialDistribution_ZernikePhase_Actin_2_0', 'Primarieswithoutborder_Granularity_26_DNA', 'Cells_Granularity_26_DNA', 'Cells_RadialDistribution_ZernikePhase_Desmin_2_0', 'Cells_Granularity_23_DNA', 'Primarieswithoutborder_Granularity_3_Brightfield', 'Cells_Granularity_28_DNA', 'Cells_RadialDistribution_ZernikePhase_DNA_2_0', 'Primarieswithoutborder_Granularity_23_PC', 'Primarieswithoutborder_Granularity_29_DNA', 'Primarieswithoutborder_Granularity_23_Brightfield', 'Primarieswithoutborder_Granularity_26_PC']
[28]:
plate = morphelia.ft.drop_outlier(plate, thresh=10, verbose=True)
Drop 24 features with outlier values: Index(['Cells_Texture_AngularSecondMoment_PC_20_01_256',
       'Cells_Texture_AngularSecondMoment_Actin_20_01_256',
       'Cells_Texture_AngularSecondMoment_Desmin_20_01_256',
       'Cells_Texture_AngularSecondMoment_Brightfield_20_01_256',
       'Primarieswithoutborder_Texture_AngularSecondMoment_DNA_10_01_256',
       'Primarieswithoutborder_Texture_AngularSecondMoment_Brightfield_10_01_256',
       'Primarieswithoutborder_Texture_Variance_Desmin_3_03_256',
       'Primarieswithoutborder_Texture_Variance_Desmin_10_00_256',
       'Primarieswithoutborder_Texture_Variance_Desmin_3_02_256',
       'Primarieswithoutborder_Texture_Variance_Desmin_3_01_256',
       'Primarieswithoutborder_Texture_Variance_Desmin_3_00_256',
       'Primarieswithoutborder_Texture_Variance_Desmin_10_02_256',
       'Primarieswithoutborder_Texture_Variance_Desmin_10_01_256',
       'Primarieswithoutborder_Texture_Variance_Desmin_10_03_256',
       'Primarieswithoutborder_Texture_SumVariance_Desmin_10_03_256',
       'Primarieswithoutborder_Texture_Contrast_Desmin_10_00_256',
       'Primarieswithoutborder_Texture_Contrast_Desmin_10_01_256',
       'Primarieswithoutborder_Texture_SumVariance_Desmin_10_02_256',
       'Primarieswithoutborder_Texture_Contrast_Desmin_10_02_256',
       'Primarieswithoutborder_Texture_SumVariance_Desmin_3_03_256',
       'Primarieswithoutborder_Texture_SumVariance_Desmin_3_02_256',
       'Primarieswithoutborder_Texture_SumVariance_Desmin_3_01_256',
       'Primarieswithoutborder_Texture_SumVariance_Desmin_3_00_256',
       'Primarieswithoutborder_Texture_Contrast_Desmin_10_03_256'],
      dtype='object')
[29]:
plate = morphelia.ft.drop_highly_correlated(plate, verbose=True, show=True)
Dropped 178 features: Index(['Primarieswithoutborder_Texture_InfoMeas1_Desmin_3_00_256',
       'Primarieswithoutborder_Texture_InfoMeas1_Desmin_10_02_256',
       'Primarieswithoutborder_Texture_InfoMeas1_Desmin_3_02_256',
       'Primarieswithoutborder_Texture_InfoMeas1_Desmin_3_01_256',
       'Primarieswithoutborder_Texture_InfoMeas1_Desmin_10_01_256',
       'Primarieswithoutborder_Texture_InfoMeas1_Desmin_10_00_256',
       'Cells_Texture_InfoMeas1_Desmin_3_01_256',
       'Cells_Texture_InfoMeas1_Desmin_3_03_256',
       'Primarieswithoutborder_Texture_InfoMeas1_Desmin_3_03_256',
       'Cells_Texture_InfoMeas1_Desmin_10_02_256',
       ...
       'Cells_Texture_SumVariance_Desmin_10_01_256',
       'Cells_Texture_Contrast_Desmin_20_03_256',
       'Cells_Texture_SumVariance_Desmin_10_00_256',
       'Cells_Texture_SumVariance_Desmin_10_02_256',
       'Cells_Intensity_IntegratedIntensity_Actin',
       'Cells_Texture_SumVariance_Desmin_3_03_256',
       'Cells_Texture_SumVariance_Desmin_3_01_256',
       'Cells_Texture_SumVariance_Desmin_3_02_256',
       'Cells_Texture_SumVariance_Desmin_3_00_256',
       'Cells_Intensity_IntegratedIntensity_Brightfield'],
      dtype='object', length=178)
[30]:
plate
[30]:
AnnData object with n_obs × n_vars = 468 × 73
    obs: 'ImageNumber', 'ObjectNumber', 'Metadata_Col', 'Metadata_Field', 'Metadata_FileLocation', 'Metadata_Frame', 'Metadata_Row', 'Metadata_Series', 'Metadata_Well', 'Cells_AreaShape_BoundingBoxArea', 'Cells_AreaShape_BoundingBoxMaximum_X', 'Cells_AreaShape_BoundingBoxMaximum_Y', 'Cells_AreaShape_BoundingBoxMinimum_X', 'Cells_AreaShape_BoundingBoxMinimum_Y', 'Cells_AreaShape_Center_X', 'Cells_AreaShape_Center_Y', 'Cells_AreaShape_EulerNumber', 'Cells_Children_Cytoplasm_Count', 'Cells_Children_Nuc_1_Count', 'Cells_Children_Nuclei_Count', 'Cells_Children_Primarieswithoutborder_Count', 'Cells_Children_Primarieswithoutborder_Count.1', 'Cells_Location_CenterMassIntensity_X_Actin', 'Cells_Location_CenterMassIntensity_X_Brightfield', 'Cells_Location_CenterMassIntensity_X_DNA', 'Cells_Location_CenterMassIntensity_X_Desmin', 'Cells_Location_CenterMassIntensity_X_PC', 'Cells_Location_CenterMassIntensity_Y_Actin', 'Cells_Location_CenterMassIntensity_Y_Brightfield', 'Cells_Location_CenterMassIntensity_Y_DNA', 'Cells_Location_CenterMassIntensity_Y_Desmin', 'Cells_Location_CenterMassIntensity_Y_PC', 'Cells_Location_CenterMassIntensity_Z_Actin', 'Cells_Location_CenterMassIntensity_Z_Brightfield', 'Cells_Location_CenterMassIntensity_Z_DNA', 'Cells_Location_CenterMassIntensity_Z_Desmin', 'Cells_Location_CenterMassIntensity_Z_PC', 'Cells_Location_Center_X', 'Cells_Location_Center_Y', 'Cells_Location_Center_Z', 'Cells_Location_MaxIntensity_X_Actin', 'Cells_Location_MaxIntensity_X_Brightfield', 'Cells_Location_MaxIntensity_X_DNA', 'Cells_Location_MaxIntensity_X_Desmin', 'Cells_Location_MaxIntensity_X_PC', 'Cells_Location_MaxIntensity_Y_Actin', 'Cells_Location_MaxIntensity_Y_Brightfield', 'Cells_Location_MaxIntensity_Y_DNA', 'Cells_Location_MaxIntensity_Y_Desmin', 'Cells_Location_MaxIntensity_Y_PC', 'Cells_Location_MaxIntensity_Z_Actin', 'Cells_Location_MaxIntensity_Z_Brightfield', 'Cells_Location_MaxIntensity_Z_DNA', 'Cells_Location_MaxIntensity_Z_Desmin', 'Cells_Location_MaxIntensity_Z_PC', 'Cells_Neighbors_FirstClosestObjectNumber_20', 'Cells_Neighbors_FirstClosestObjectNumber_Adjacent', 'Cells_Neighbors_NumberOfNeighbors_20', 'Cells_Neighbors_NumberOfNeighbors_Adjacent', 'Cells_Neighbors_SecondClosestObjectNumber_20', 'Cells_Neighbors_SecondClosestObjectNumber_Adjacent', 'Cells_Number_Object_Number', 'Cells_Parent_Nuc_10', 'Cells_Parent_Primarieswithoutborder', 'Primarieswithoutborder_AreaShape_BoundingBoxArea', 'Primarieswithoutborder_AreaShape_BoundingBoxMaximum_X', 'Primarieswithoutborder_AreaShape_BoundingBoxMaximum_Y', 'Primarieswithoutborder_AreaShape_BoundingBoxMinimum_X', 'Primarieswithoutborder_AreaShape_BoundingBoxMinimum_Y', 'Primarieswithoutborder_AreaShape_Center_X', 'Primarieswithoutborder_AreaShape_Center_Y', 'Primarieswithoutborder_AreaShape_EulerNumber', 'Primarieswithoutborder_Children_Cells_Count', 'Primarieswithoutborder_Children_Cytoplasm_Count', 'Primarieswithoutborder_Children_Primaries_Count', 'Primarieswithoutborder_Location_CenterMassIntensity_X_Actin', 'Primarieswithoutborder_Location_CenterMassIntensity_X_Brightfield', 'Primarieswithoutborder_Location_CenterMassIntensity_X_DNA', 'Primarieswithoutborder_Location_CenterMassIntensity_X_Desmin', 'Primarieswithoutborder_Location_CenterMassIntensity_X_PC', 'Primarieswithoutborder_Location_CenterMassIntensity_Y_Actin', 'Primarieswithoutborder_Location_CenterMassIntensity_Y_Brightfield', 'Primarieswithoutborder_Location_CenterMassIntensity_Y_DNA', 'Primarieswithoutborder_Location_CenterMassIntensity_Y_Desmin', 'Primarieswithoutborder_Location_CenterMassIntensity_Y_PC', 'Primarieswithoutborder_Location_CenterMassIntensity_Z_Actin', 'Primarieswithoutborder_Location_CenterMassIntensity_Z_Brightfield', 'Primarieswithoutborder_Location_CenterMassIntensity_Z_DNA', 'Primarieswithoutborder_Location_CenterMassIntensity_Z_Desmin', 'Primarieswithoutborder_Location_CenterMassIntensity_Z_PC', 'Primarieswithoutborder_Location_Center_X', 'Primarieswithoutborder_Location_Center_Y', 'Primarieswithoutborder_Location_Center_Z', 'Primarieswithoutborder_Location_MaxIntensity_X_Actin', 'Primarieswithoutborder_Location_MaxIntensity_X_Brightfield', 'Primarieswithoutborder_Location_MaxIntensity_X_DNA', 'Primarieswithoutborder_Location_MaxIntensity_X_Desmin', 'Primarieswithoutborder_Location_MaxIntensity_X_PC', 'Primarieswithoutborder_Location_MaxIntensity_Y_Actin', 'Primarieswithoutborder_Location_MaxIntensity_Y_Brightfield', 'Primarieswithoutborder_Location_MaxIntensity_Y_DNA', 'Primarieswithoutborder_Location_MaxIntensity_Y_Desmin', 'Primarieswithoutborder_Location_MaxIntensity_Y_PC', 'Primarieswithoutborder_Location_MaxIntensity_Z_Actin', 'Primarieswithoutborder_Location_MaxIntensity_Z_Brightfield', 'Primarieswithoutborder_Location_MaxIntensity_Z_DNA', 'Primarieswithoutborder_Location_MaxIntensity_Z_Desmin', 'Primarieswithoutborder_Location_MaxIntensity_Z_PC', 'Primarieswithoutborder_Number_Object_Number', 'Primarieswithoutborder_Parent_Cells', 'Primarieswithoutborder_Parent_Nuc_10', 'Cytoplasm_AreaShape_BoundingBoxArea', 'Cytoplasm_AreaShape_BoundingBoxMaximum_X', 'Cytoplasm_AreaShape_BoundingBoxMaximum_Y', 'Cytoplasm_AreaShape_BoundingBoxMinimum_X', 'Cytoplasm_AreaShape_BoundingBoxMinimum_Y', 'Cytoplasm_AreaShape_Center_X', 'Cytoplasm_AreaShape_Center_Y', 'Cytoplasm_AreaShape_EulerNumber', 'Cytoplasm_Location_CenterMassIntensity_X_Actin', 'Cytoplasm_Location_CenterMassIntensity_X_Brightfield', 'Cytoplasm_Location_CenterMassIntensity_X_DNA', 'Cytoplasm_Location_CenterMassIntensity_X_Desmin', 'Cytoplasm_Location_CenterMassIntensity_X_PC', 'Cytoplasm_Location_CenterMassIntensity_Y_Actin', 'Cytoplasm_Location_CenterMassIntensity_Y_Brightfield', 'Cytoplasm_Location_CenterMassIntensity_Y_DNA', 'Cytoplasm_Location_CenterMassIntensity_Y_Desmin', 'Cytoplasm_Location_CenterMassIntensity_Y_PC', 'Cytoplasm_Location_CenterMassIntensity_Z_Actin', 'Cytoplasm_Location_CenterMassIntensity_Z_Brightfield', 'Cytoplasm_Location_CenterMassIntensity_Z_DNA', 'Cytoplasm_Location_CenterMassIntensity_Z_Desmin', 'Cytoplasm_Location_CenterMassIntensity_Z_PC', 'Cytoplasm_Location_Center_X', 'Cytoplasm_Location_Center_Y', 'Cytoplasm_Location_MaxIntensity_X_Actin', 'Cytoplasm_Location_MaxIntensity_X_Brightfield', 'Cytoplasm_Location_MaxIntensity_X_DNA', 'Cytoplasm_Location_MaxIntensity_X_Desmin', 'Cytoplasm_Location_MaxIntensity_X_PC', 'Cytoplasm_Location_MaxIntensity_Y_Actin', 'Cytoplasm_Location_MaxIntensity_Y_Brightfield', 'Cytoplasm_Location_MaxIntensity_Y_DNA', 'Cytoplasm_Location_MaxIntensity_Y_Desmin', 'Cytoplasm_Location_MaxIntensity_Y_PC', 'Cytoplasm_Location_MaxIntensity_Z_Actin', 'Cytoplasm_Location_MaxIntensity_Z_Brightfield', 'Cytoplasm_Location_MaxIntensity_Z_DNA', 'Cytoplasm_Location_MaxIntensity_Z_Desmin', 'Cytoplasm_Location_MaxIntensity_Z_PC', 'Cytoplasm_Number_Object_Number', 'Cytoplasm_Parent_Cells', 'Cytoplasm_Parent_Primarieswithoutborder', 'Metadata_Treatment', 'Metadata_Concentration', 'Metadata_Unit'
    uns: 'duplicated_feats', 'invariant_feats', 'noisy_feats', 'near_zero_variance_feats', 'outlier_feats', 'highly_correlated'
We reduced the features from 2961 to 73.
Step 4: Downstream Analysis
This includes for example: * Principal Component Analysis * Manifold Learning (UMAP, t-SNE)
[31]:
# calculate PCA
sc.tl.pca(plate)
[32]:
# plot the variance ratio
morphelia.pl.pca_variance_ratio(plate)
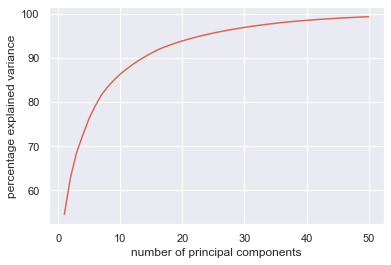
The first 20 compoinents cover ~95% of the variance.
[33]:
# calculate k-nn graph
sc.pp.neighbors(plate, n_neighbors=8, n_pcs=20)
[34]:
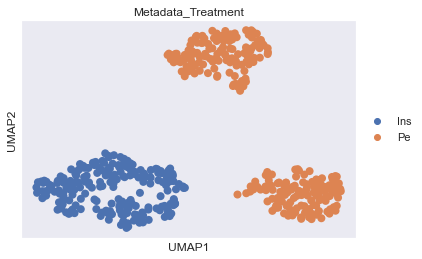
# calculate UMAP
sc.tl.umap(plate)
[35]:
# Plot UMAP
sc.pl.umap(plate, color="Metadata_Treatment")
Other
Aggregation
Often, only aggregated profiles, so-called consensus profiles, are used for downstream analysis. Aggregation can be done per well or treatment by mean or median aggregation.
[40]:
plate_agg = morphelia.pp.aggregate(plate, by='Metadata_Well')
plate_agg
C:\Users\amarx\Anaconda3\envs\morphelia\lib\site-packages\anndata\_core\anndata.py:120: ImplicitModificationWarning: Transforming to str index.
  warnings.warn("Transforming to str index.", ImplicitModificationWarning)
[40]:
AnnData object with n_obs × n_vars = 2 × 73
    obs: 'ImageNumber', 'ObjectNumber', 'Metadata_Col', 'Metadata_Field', 'Metadata_FileLocation', 'Metadata_Frame', 'Metadata_Row', 'Metadata_Series', 'Metadata_Well', 'Cells_AreaShape_BoundingBoxArea', 'Cells_AreaShape_BoundingBoxMaximum_X', 'Cells_AreaShape_BoundingBoxMaximum_Y', 'Cells_AreaShape_BoundingBoxMinimum_X', 'Cells_AreaShape_BoundingBoxMinimum_Y', 'Cells_AreaShape_Center_X', 'Cells_AreaShape_Center_Y', 'Cells_AreaShape_EulerNumber', 'Cells_Children_Cytoplasm_Count', 'Cells_Children_Nuc_1_Count', 'Cells_Children_Nuclei_Count', 'Cells_Children_Primarieswithoutborder_Count', 'Cells_Children_Primarieswithoutborder_Count.1', 'Cells_Location_CenterMassIntensity_X_Actin', 'Cells_Location_CenterMassIntensity_X_Brightfield', 'Cells_Location_CenterMassIntensity_X_DNA', 'Cells_Location_CenterMassIntensity_X_Desmin', 'Cells_Location_CenterMassIntensity_X_PC', 'Cells_Location_CenterMassIntensity_Y_Actin', 'Cells_Location_CenterMassIntensity_Y_Brightfield', 'Cells_Location_CenterMassIntensity_Y_DNA', 'Cells_Location_CenterMassIntensity_Y_Desmin', 'Cells_Location_CenterMassIntensity_Y_PC', 'Cells_Location_CenterMassIntensity_Z_Actin', 'Cells_Location_CenterMassIntensity_Z_Brightfield', 'Cells_Location_CenterMassIntensity_Z_DNA', 'Cells_Location_CenterMassIntensity_Z_Desmin', 'Cells_Location_CenterMassIntensity_Z_PC', 'Cells_Location_Center_X', 'Cells_Location_Center_Y', 'Cells_Location_Center_Z', 'Cells_Location_MaxIntensity_X_Actin', 'Cells_Location_MaxIntensity_X_Brightfield', 'Cells_Location_MaxIntensity_X_DNA', 'Cells_Location_MaxIntensity_X_Desmin', 'Cells_Location_MaxIntensity_X_PC', 'Cells_Location_MaxIntensity_Y_Actin', 'Cells_Location_MaxIntensity_Y_Brightfield', 'Cells_Location_MaxIntensity_Y_DNA', 'Cells_Location_MaxIntensity_Y_Desmin', 'Cells_Location_MaxIntensity_Y_PC', 'Cells_Location_MaxIntensity_Z_Actin', 'Cells_Location_MaxIntensity_Z_Brightfield', 'Cells_Location_MaxIntensity_Z_DNA', 'Cells_Location_MaxIntensity_Z_Desmin', 'Cells_Location_MaxIntensity_Z_PC', 'Cells_Neighbors_FirstClosestObjectNumber_20', 'Cells_Neighbors_FirstClosestObjectNumber_Adjacent', 'Cells_Neighbors_NumberOfNeighbors_20', 'Cells_Neighbors_NumberOfNeighbors_Adjacent', 'Cells_Neighbors_SecondClosestObjectNumber_20', 'Cells_Neighbors_SecondClosestObjectNumber_Adjacent', 'Cells_Number_Object_Number', 'Cells_Parent_Nuc_10', 'Cells_Parent_Primarieswithoutborder', 'Primarieswithoutborder_AreaShape_BoundingBoxArea', 'Primarieswithoutborder_AreaShape_BoundingBoxMaximum_X', 'Primarieswithoutborder_AreaShape_BoundingBoxMaximum_Y', 'Primarieswithoutborder_AreaShape_BoundingBoxMinimum_X', 'Primarieswithoutborder_AreaShape_BoundingBoxMinimum_Y', 'Primarieswithoutborder_AreaShape_Center_X', 'Primarieswithoutborder_AreaShape_Center_Y', 'Primarieswithoutborder_AreaShape_EulerNumber', 'Primarieswithoutborder_Children_Cells_Count', 'Primarieswithoutborder_Children_Cytoplasm_Count', 'Primarieswithoutborder_Children_Primaries_Count', 'Primarieswithoutborder_Location_CenterMassIntensity_X_Actin', 'Primarieswithoutborder_Location_CenterMassIntensity_X_Brightfield', 'Primarieswithoutborder_Location_CenterMassIntensity_X_DNA', 'Primarieswithoutborder_Location_CenterMassIntensity_X_Desmin', 'Primarieswithoutborder_Location_CenterMassIntensity_X_PC', 'Primarieswithoutborder_Location_CenterMassIntensity_Y_Actin', 'Primarieswithoutborder_Location_CenterMassIntensity_Y_Brightfield', 'Primarieswithoutborder_Location_CenterMassIntensity_Y_DNA', 'Primarieswithoutborder_Location_CenterMassIntensity_Y_Desmin', 'Primarieswithoutborder_Location_CenterMassIntensity_Y_PC', 'Primarieswithoutborder_Location_CenterMassIntensity_Z_Actin', 'Primarieswithoutborder_Location_CenterMassIntensity_Z_Brightfield', 'Primarieswithoutborder_Location_CenterMassIntensity_Z_DNA', 'Primarieswithoutborder_Location_CenterMassIntensity_Z_Desmin', 'Primarieswithoutborder_Location_CenterMassIntensity_Z_PC', 'Primarieswithoutborder_Location_Center_X', 'Primarieswithoutborder_Location_Center_Y', 'Primarieswithoutborder_Location_Center_Z', 'Primarieswithoutborder_Location_MaxIntensity_X_Actin', 'Primarieswithoutborder_Location_MaxIntensity_X_Brightfield', 'Primarieswithoutborder_Location_MaxIntensity_X_DNA', 'Primarieswithoutborder_Location_MaxIntensity_X_Desmin', 'Primarieswithoutborder_Location_MaxIntensity_X_PC', 'Primarieswithoutborder_Location_MaxIntensity_Y_Actin', 'Primarieswithoutborder_Location_MaxIntensity_Y_Brightfield', 'Primarieswithoutborder_Location_MaxIntensity_Y_DNA', 'Primarieswithoutborder_Location_MaxIntensity_Y_Desmin', 'Primarieswithoutborder_Location_MaxIntensity_Y_PC', 'Primarieswithoutborder_Location_MaxIntensity_Z_Actin', 'Primarieswithoutborder_Location_MaxIntensity_Z_Brightfield', 'Primarieswithoutborder_Location_MaxIntensity_Z_DNA', 'Primarieswithoutborder_Location_MaxIntensity_Z_Desmin', 'Primarieswithoutborder_Location_MaxIntensity_Z_PC', 'Primarieswithoutborder_Number_Object_Number', 'Primarieswithoutborder_Parent_Cells', 'Primarieswithoutborder_Parent_Nuc_10', 'Cytoplasm_AreaShape_BoundingBoxArea', 'Cytoplasm_AreaShape_BoundingBoxMaximum_X', 'Cytoplasm_AreaShape_BoundingBoxMaximum_Y', 'Cytoplasm_AreaShape_BoundingBoxMinimum_X', 'Cytoplasm_AreaShape_BoundingBoxMinimum_Y', 'Cytoplasm_AreaShape_Center_X', 'Cytoplasm_AreaShape_Center_Y', 'Cytoplasm_AreaShape_EulerNumber', 'Cytoplasm_Location_CenterMassIntensity_X_Actin', 'Cytoplasm_Location_CenterMassIntensity_X_Brightfield', 'Cytoplasm_Location_CenterMassIntensity_X_DNA', 'Cytoplasm_Location_CenterMassIntensity_X_Desmin', 'Cytoplasm_Location_CenterMassIntensity_X_PC', 'Cytoplasm_Location_CenterMassIntensity_Y_Actin', 'Cytoplasm_Location_CenterMassIntensity_Y_Brightfield', 'Cytoplasm_Location_CenterMassIntensity_Y_DNA', 'Cytoplasm_Location_CenterMassIntensity_Y_Desmin', 'Cytoplasm_Location_CenterMassIntensity_Y_PC', 'Cytoplasm_Location_CenterMassIntensity_Z_Actin', 'Cytoplasm_Location_CenterMassIntensity_Z_Brightfield', 'Cytoplasm_Location_CenterMassIntensity_Z_DNA', 'Cytoplasm_Location_CenterMassIntensity_Z_Desmin', 'Cytoplasm_Location_CenterMassIntensity_Z_PC', 'Cytoplasm_Location_Center_X', 'Cytoplasm_Location_Center_Y', 'Cytoplasm_Location_MaxIntensity_X_Actin', 'Cytoplasm_Location_MaxIntensity_X_Brightfield', 'Cytoplasm_Location_MaxIntensity_X_DNA', 'Cytoplasm_Location_MaxIntensity_X_Desmin', 'Cytoplasm_Location_MaxIntensity_X_PC', 'Cytoplasm_Location_MaxIntensity_Y_Actin', 'Cytoplasm_Location_MaxIntensity_Y_Brightfield', 'Cytoplasm_Location_MaxIntensity_Y_DNA', 'Cytoplasm_Location_MaxIntensity_Y_Desmin', 'Cytoplasm_Location_MaxIntensity_Y_PC', 'Cytoplasm_Location_MaxIntensity_Z_Actin', 'Cytoplasm_Location_MaxIntensity_Z_Brightfield', 'Cytoplasm_Location_MaxIntensity_Z_DNA', 'Cytoplasm_Location_MaxIntensity_Z_Desmin', 'Cytoplasm_Location_MaxIntensity_Z_PC', 'Cytoplasm_Number_Object_Number', 'Cytoplasm_Parent_Cells', 'Cytoplasm_Parent_Primarieswithoutborder', 'Metadata_Treatment', 'Metadata_Concentration', 'Metadata_Unit', 'Metadata_Cellnumber'
    obsm: 'X_pca', 'X_umap'
Feature clustering
[53]:
feature_tags = {'AreaShape': 1,
                'Intensity': 2,
                'Texture': 3,
                'Granularity': 4}

feature_classes = []
for feat in plate.var_names:
    if any(tag in feat for tag in feature_tags.keys()):
        for tag in feature_tags.keys():
            if tag in feat:
                feature_classes.append(feature_tags[tag])
                break
    else:
        feature_classes.append(0)
[63]:
# make new transposed anndata object
obs = pd.DataFrame({'name': plate.var_names,
                    'feature_class': feature_classes})
obs['feature_class'] = obs['feature_class'].astype('category')
var = pd.DataFrame(index=np.arange(len(plate)))

feat_data = ad.AnnData(X=plate.X.T, obs=obs, var=var)
feat_data
C:\Users\amarx\Anaconda3\envs\morphelia\lib\site-packages\anndata\_core\anndata.py:120: ImplicitModificationWarning: Transforming to str index.
  warnings.warn("Transforming to str index.", ImplicitModificationWarning)
[63]:
AnnData object with n_obs × n_vars = 73 × 468
    obs: 'name', 'feature_class'
[64]:
# calculate PCA
sc.tl.pca(feat_data)
[65]:
# plot the variance ratio
morphelia.pl.pca_variance_ratio(feat_data)
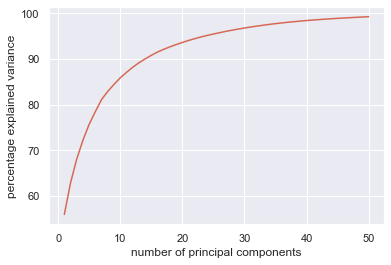
The first 20 compoinents cover ~95% of the variance.
[66]:
# calculate k-nn graph
sc.pp.neighbors(feat_data, n_neighbors=8, n_pcs=20)
[67]:
# calculate UMAP
sc.tl.umap(feat_data)
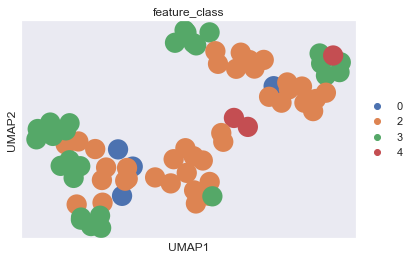
[68]:
# Plot UMAP
sc.pl.umap(feat_data, color="feature_class")
[ ]: